America’s stock market has swollen to a size that dwarfs every valuation extreme of the past four decades, according to JPMorgan Asset Management’s chief global strategist — a warning that dropped just days after a separate McKinsey study found the world’s wealth is increasingly decoupled from real economic growth.
On Aug. 10, David Kelly calculated that “the market value of all U.S. corporate equity is now over 400% of GDP.” That compares with 244% just before the pandemic, 204% at the peak of 2000’s dotcom bubble, and 74% before the 1987 stock market crash known as Black Monday.
If it sounds familiar, that’s because Kelly’s metric is almost like the famous Buffett Indicator — the ratio of the total value of publicly listed U.S. companies to GDP — but it’s a bit broader, covering all U.S. corporate equity, not just publicly traded stocks. The Buffett Indicator itself is above 200%, “strongly overvalued” or far beyond historic norms. When the Oracle of Omaha debuted this metric in Fortune in 2001, in co-authorship with Carol Loomis, they called it “probably the best single measure of where valuations stand at any given moment.” At the time, they noted that the ratio had reached an unprecedented level in the late 1990s: “That should have been a very strong warning signal.”
Fast forward to 2026, and the S&P 500 is up more than 13% year to date, following three blockbuster years after the game-changing release of OpenAI’s ChatGPT. Underlining how much AI exuberance has boosted the market, Kelly found that second-quarter earnings included $150 billion of unrealized capital gains booked by just two large technology companies. That boosted pro forma earnings per share by 50% year over year. But after stripping that out, earnings growth was closer to 20%.
He offered a warning about how Wall Street still isn’t Main Street. “In the end,” he wrote, “the value of American corporations depends, to a large extent, on the work and spending of the American people.” He argued that stock prices are unlikely to keep soaring “unless the fortunes of American consumers and American workers see broader improvement.” That’s where the infamously K-shaped economy comes in.
K-shape or C-shape?
The huge profit gains on Wall Street contrast with a real economy marked by meager job growth, wage growth trailing inflation for four straight months, and stagnant homebuilding. Kelly predicted that payrolls should grow 50,000 to 100,000 per month going forward — but July’s poor report and downward revision for earlier months call that into question.
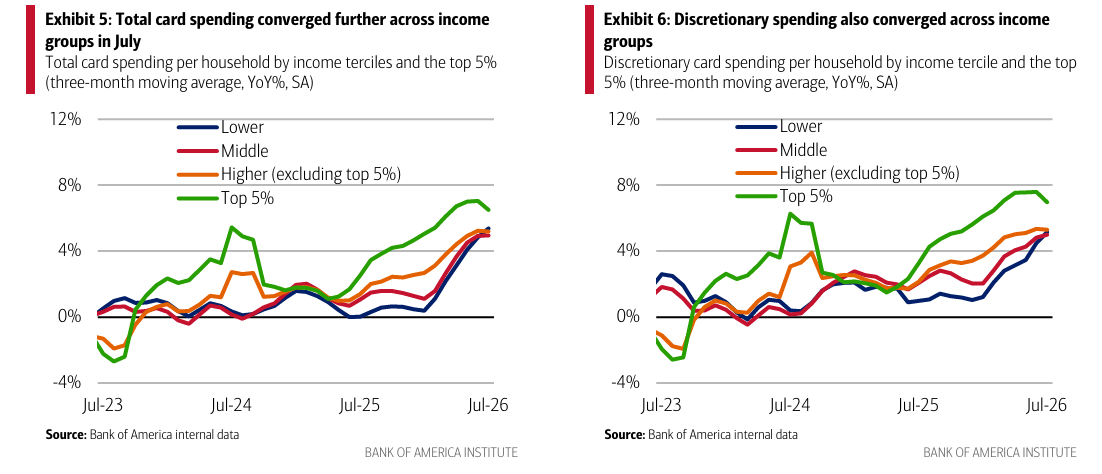
Bank of America Institute flagged at nearly the same time that wage and spending gains have started to “converge” across income brackets. Internal spending data showed a 5.4% increase in spending among lower-income households in July, compared to 4.9% for middle-income households.
Several days later, Apollo Global Management Chef Economist Torsten Slok noted the big box-office receipts for Spider-Man and The Odyssey show that “the consumer isn’t tapped out.”
Treasury Secretary Scott Bessent, in a CNBC interview several days earlier in August, pointed to 5.5% wage gains for the bottom quartile and declared that the “K-shaped economy is over.”
The much-hyped K-shaped economy, representing diverging outcomes for the wealthiest and poorest, is just outdated based on the data, he argued. “I got sick of hearing about this K-shaped economy,” he said, explaining that “we’re seeing more of a C economy where the lower end of wage earners are finally calling it back.”
BofA’s spending data, however, showed that there remains one “exception”: the top 5% of earners, “where strong balance sheets and rising asset prices continue to support outsized spending growth.” If the AI-led wealth boom leads to a more widely shared expansion, the economy could move off its current dependence on affluent customers and a concentrated group of big tech firms.
The pattern holds true around the world, based on McKinsey Global Institute’s Global Balance Sheet 2026 report, published in July. It found that the world’s total stock of assets reached nearly $1.8 quadrillion in 2025, up from $1.7 quadrillion the year before, and that global household wealth grew to a record $570 trillion.
Most of this, the institute found, was “paper wealth,” with the U.S. equity market sitting dead center at the dynamic. American stocks were valued at 3.7x GDP and 2.4X the net assets on corporate balance sheets.
Kelly, for his part, is betting on a softer landing for the economy, saying he expects the Federal Reserve to hold interest rates steady, inflation to keep drifting down toward the Fed’s 2% target, and GDP growth to average about 2% next year. He advised investors to diversify away from a concentrated bet on AI stocks. The great convergence could very well continue, but until then, the gap between paper wealth and the real economy is stretched further than ever before.
#GDP #top #analyst #finds #corporate #equity #double #level #dotcom #bubble #triple #1987s #Black #Monday